Data and charting service on Meteor’s M126 BIGMAR cruise

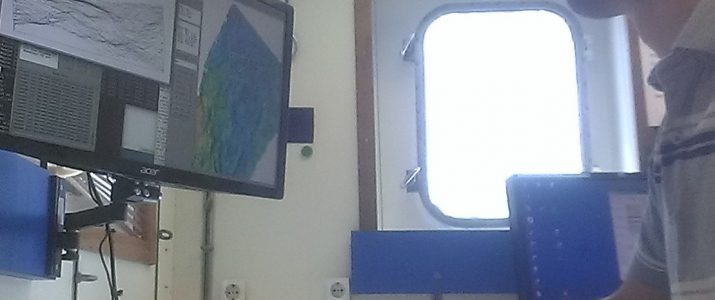
Finding and exploring hydrothermal vents at the Mid-Atlantic Ridge was the objective of a scientific crew sailing on RV "Meteor" in April 2016 which had kindly asked FIELAX to support. A colleague of us attend the cruise, mapped wide areas of the deep sea ridge structures with the ship's multibeam echosounder and processed the data to maps. He also processed and managed acquired photography and navigation data from the MARUM's ROV "Quest" in order to quickly get overview maps and results to support cruise planning and documentation. The contractor was Prof. Dr. Nicole Dubilier from Max Planck Institute for Marine Microbiology in Bremen. Read more

FIELAX reaches new depths: 5432m to be exact!

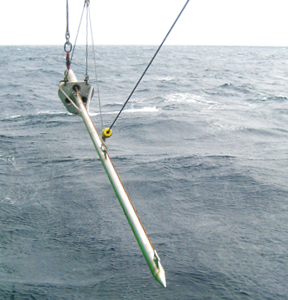
FIELAX likes to announce the successful performance of a heat flow measurement in a water depth of more than 5400m. On board the RV Investigator, FIELAX has performed heat flow measurements in the Bight Basin (Offshore South Australia) for the Commonwealth Scientific and Industrial Research Organisation (CSIRO), in cooperation with Chevron. The deepest station measurment was performed in 5432m water depth, a new record for FIELAX and our equipment.

Map viewer for sea floor images

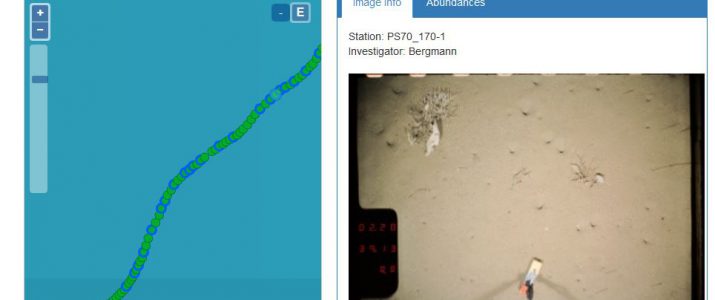
The brand new "OFOS-Viewer" (Ocean Floor Observation System) combines map and seabed image gallery in a user-friendly web tool. Images, geo positions and meta information from several stations and campaigns can be aggregated and visualized. The tool is currently available at www.awi.de: Select a station and go!

Navigation data processing “Master Track”

On behalf of Alfred-Wegener-Institut Helmholtz-Zentrum für Polar- und Meeresforschung we post-processed navigation data from former campaigns of the research vessels Polarstern and Heincke. The job was about data validation, filtering, interpolation, generalization and documentation of all applied processes. The objective was to achieve a valid "master track" for each campaign which will be used for georeferencing scientific data and for visualization in data portals. Read more